In this blog we go through the kNN algorithm logic, implement it from scratch in python and apply it on the MNIST digit dataset
Prerequisites
machine learning, supervised vs unsupervised ML, classification vs regression
Introduction
The K Nearest Neighbour classification is a simple and efficient machine learning model that can used for classification. While there are more complex classification models, if establishing a model with some training dataset is proving troublesome, it is likely that a kNN algorithm will provide the best solution. kNN is considered to be one of the top 10 data mining algorithms for this reason.
kNN is not a model based classifier, instead it is called a lazy learner, as it performs classification tasks without building its model. In other words, the model does not have a “training” phase like other common machine learning models. The reasons for this will become apparent after I explain the model with an example.
This algorithm works on the concept of “similarity” between data points. This can easily be visualized by using a 2 dimensional dataset.
Explanation with dummy data
Let’s say we wish to create a machine learning model that knows how to classify images of cats and dogs. For any ML model, we must have some data that highlights the different characteristics of both animals. Let us create this dataset ourselves, that would be pretty fun! The two characteristics that we choose could be as follows -
- The sharpness of its claws
- The length of its ears
Using these two features, we can end up with a model that has a reasonable accuracy. First, lets build a dataset for the problem. I’ll be doing this by measuring 4 legged mammals in my area ;). brb!
Disclaimer - No animals were harmed in the creation of this blog
Let’s say the data I have is as follows -
| Animal | Sharpness of its claws (cm) | Length of its ears (cm) |
|---|---|---|
| Cat | 4 | 1 |
| Cat | 5 | 2 |
| Cat | 4 | 3 |
| Dog | 1 | 3 |
| Dog | 2 | 4 |
| Dog | 2 | 6 |
This data is classified into two classes, cat and dog. The data consists of two columns, the first one is called the label column. This identifies which class a data point is supposed to be in, and the second column is our features column.
Plotting them results in a graph as shown below. Notice how similar animals are grouped “together” in the plot? This property is what kNN uses to perform classification.

Now that we have our training data, let’s introduce a new unknown animal with the features (2.5, 4). Our model needs to able to determine if the unknown animal is a cat or a dog i.e. which class it belongs to. (Spoiler alert: it’s a cat! But our model doesn’t know that :p)

The nearest neighbour algorithm finds the data point that is “closest” to our unknown point. The way we measure this “closeness” can be through common methods, like euclidean or cosine distance. Here, I will be using the euclidean distance equation for the demonstration.
$$ d(p,q) = sqrt{\sum_{i=1}^n (q_i - p_i)^2} $$
By calculating the Euclidean distance between our unknown point and all the other points, we identify that the point (2,4) is the closest. This particular point corresponds to a cat, leading the nearest neighbor algorithm to conclude that our unknown point is also a cat. However, it’s important to recognize that this approach is highly vulnerable to overfitting. To put it simply, if our data contains a few outliers, the accuracy of the model’s predictions can be compromised. In our specific scenario, even if the unknown data point is closer to the cluster of cat data points, if the closest point happens to be that of a dog, the model will incorrectly classify the unknown point as a dog.
To address this concern, we employ the K Nearest Neighbor (KNN) algorithm, which is the focal point of this article. Here, instead of identifying a single closest point, we determine K points that are sorted based on their distance to the unknown point, arranged in ascending order. Among these K points, we observe which class value appears most frequently, and that becomes the predicted class for the unknown point. By considering multiple neighbors rather than just one, the KNN algorithm enhances the accuracy and robustness of our predictions.
Consider K=3 as an example. In the graph below, the green circle encompasses the points within it. Notably, there are 2 points belonging to the “Cat” class and 1 point belonging to the “Dog” class. By applying the k-nearest neighbors (kNN) model, we correctly predict that the unknown animal is a cat. The green circle in this context is commonly known as the “decision boundary.”

The functioning of the kNN model on a simplistic dataset illustrates its mechanics. However, it is essential to recognize that real-world machine learning problems typically involve more complex datasets. Nonetheless, this example serves as a valuable tool for developing our understanding and intuition about how the model operates.1
Coding kNN model from scratch
Now let’s create this model from scratch in python. Since it is a lazy learning algortihm, we do not need a training phase. We just need the training data and an unlabelled instance for prediction. So the algorithm needs features, labels, and the data instance to be predicted as an input. We’ll choose an arbitrary value of K for this example.2 We also need a helper function to calculate the euclidean distance between two vectors.
|
|
That’s the whole code! It really is a pretty simple learning algorithm. Now all we need a wrapper function to accept the input and return the prediction to the user.
|
|
Please not that our implementation is not very optimized and really should be only used to learn how the model works. 3
Applying the model on a standard dataset
As written on kaggle -
“MNIST (“Modified National Institute of Standards and Technology”) is the de facto “hello world” dataset of computer vision. Since its release in 1999, this classic dataset of handwritten images has served as the basis for benchmarking classification algorithms. As new machine learning techniques emerge, MNIST remains a reliable resource for researchers and learners alike.”
So it’s a pretty standard dataset! Let’s use this to evaluate our model’s performance! First let’s get the dataset from kaggle and read it using pandas!
The shape of this data is (60000, 785). This means that each row is a vector containing a digit representation. That comes out to a total of 60000 images in the training dataset. The digit is represented as a 1x784 vector. So then why is the shape 785? This is because the last column is a label that stores what digit is represented by that particular row.
Then we use numpy to store the data into train, test datasets.
|
|
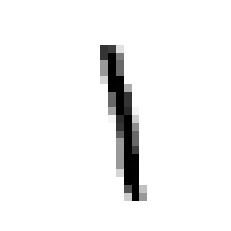
Now let’s see what an image from this dataset looks like, and print the label.
|
|
OUTPUT:
1.0

That looks pretty good! This means that the 31st vector stored in out test dataset corresponds to this image of the digit ‘1’. So now we have confirmed that the data is indeed stored and labelled properly. It’s time to unleash our kNN model on this dataset! Let us try to predict the result we get for the same test input. If everything goes well, we should get ‘1’ as the predicted output.
And we do! Our predict function predicted correctly that the image shown was that of a 1. Here also, the k value that we passed to the function was completely arbitrary. Now let’s properly evaluate the model on the entire test set.
The accuracy comes out to about 90%. Now I should say that this accuracy can be improved by selecting a better value of k, but it’s not bad for a model without any hyperparameter tuning.
Footnotes
-
You could extend the same principles to higher dimensions. Here we have 2 features, so we only have to visualize 2 dimensions. But for most problems, it’s common for there to be a lot of dimensions, millions even. It’s difficult to imagine problems in a higher dimension, so working on them in lower dimensions while learning is a good idea! Quick detour on this topic here. ↩︎
-
It should be noted that there does exist algorithms for choosing an ideal value of K based on the training dataset. You can learn more here. ↩︎
-
Optimizations can be made to the algorithm such that some of the computation can be skipped, but this discussion is out of the scope of this article. Feel free to read up on it here ↩︎